Mostrando entradas con la etiqueta Normal curve. Mostrar todas las entradas

domingo, 24 de febrero de 2019

When reality can not be explained, can we change theories or analytical tools?


When reality can not be explained, can we change theories or analytical tools?


In Mathematics a special term, invariance, is used. What is an invariant? In the simplest terms, an invariant is something that does not change. The invariance is a very powerful property that allows to address problems with games, colors, symmetry, parity, induction. A problem of invariance presents many forms, the most difficult thing is to recognize it.

In object-oriented programming and functional programming, an "immutable object" is an object whose state can not be modified once created. An object can be considered immutable, although some of its internal attributes change, as long as the state of the object does not seem to change from an external point of view. Immutable objects are useful because they are safe in multiple and complex environments; they are also easy to understand and it is easy to reason about them; besides offering greater security than mutable objects.

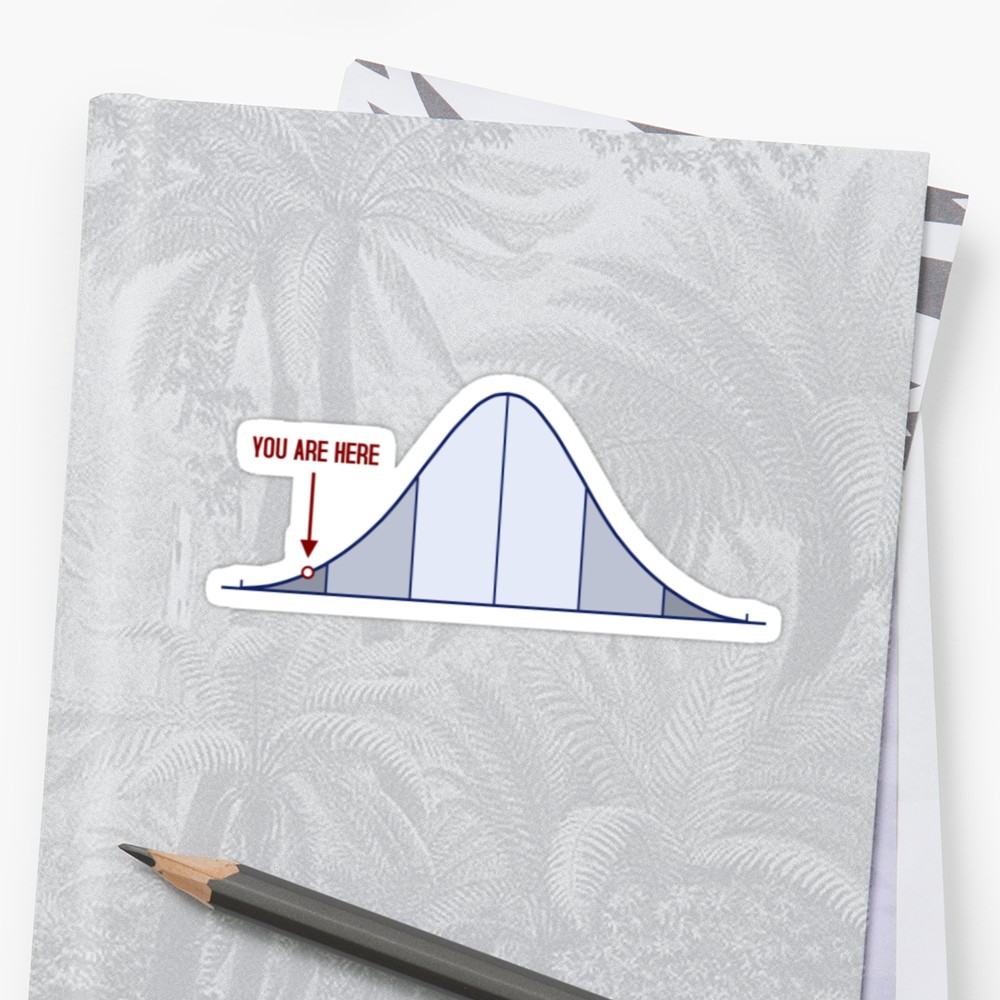
In real life, in business, in the field of scientific research, in any field, data are generated that must be analyzed to make decisions. The data is organized or distributed so that conclusions and answers about the content and meaning can be obtained. The most general distribution is the Normal Distribution Curve, a symmetric, bell-shaped curve that contains the total data equally distributed on both sides of three core values ​​(median, and mode). For the population, a parameter called standard deviation determines to which distance from the center other values ​​are found. In the curve, the areas are probabilities calculated between chosen values.

When the real distributions are not normal, but certain requirements like the Central Limit Theorem are met, it is possible to approximate or adjust the distributions towards the normal. In a sense, is the normal distribution like an invariant? Literally, everything can be explained with its rules.


In today's world, technology has exponentially multiplied the capacity to generate data. A decade ago, a megabyte was a great magnitude. Today it hardly equals the content of a high resolution photo. We are already in the petabyte era, names have been defined for the new units. The Brontobyte (remembering the brontosaurs?) Is still not used. Will the normal curve follow its throne, or will it have to be changed?

Is it possible? The "normal curve of the brontosaurus" is bizarre, unusual, rare, unexpected, anomalous, abnormal, unusual, strange, infrequent, exceptional, singular, but is not that also the world? A single example: Couples that go out to lunch, neither look at each other nor see what they eat; friends who are in a meeting and nobody could tell how the friend sitting next to him is dressed because they are absorbed with the toy; people who walk down the street and need clever sticks like the blind to avoid hitting people or walls. Everything that seemed exaggerated imagination in the past, is routine today.


jueves, 21 de febrero de 2019

The normal distribution or "Gaussian Bell": How to change your luck


The normal distribution or "Gaussian Bell": How to change your luck

The normal distribution is a continuous variable probability distribution that describes the data that is grouped around a central value. Any process where the values ​​change for random causes or chance, has normal distribution. This condition is frequent in natural phenomena (hence the name "normal"). The graphical representation is the normal distribution curve, also called bell of Gauss in honor of Carl Friedrich Gauss, who is wrongly attributed his invention and who used it frequently to analyze astronomical phenomena.

The normal distribution is the most known and used of all the distributions, it is the reference standard for many probability problems. Some applications in measurement, psychology, education (Each case will be developed later, with details and calculations).

(i) Determine the percentage of cases within limits, scores or given values.
(ii) Determine the percentage of cases that are above or below a given score, point or reference value.
(iii) Determine the limits of scores that include a given percentage of cases
(iv) Determine the percentile rank of a student in his group.
(v) Find out the percentile value of the percentile rank of a student.
(vi) Compare the two distributions in terms of overlap.
(vii) Determine the relative difficulty of the evidence, and
(viii) Divide a group into subgroups according to a certain capacity or ability and assign the corresponding qualification.

In practice, in general, you do not know the actual distribution of your population, but you can approximate it by a normal distribution with reasonable precision, relying on Lyapunov's Theorem or "Central Limit Theorem" (TLC). The justification lies in the randomness of the data, the presence of many independent factors and the size of the sample (30 or more). With more correction, instead of the theoretical verification of its distribution, a normality test is applied to see if the approximation to normality from the sample is possible.

This procedure is very useful when you do not know the mean or variance of a population and you have to make an estimate from the statistics of the samples. By NAFTA, the distribution of sample means of a population of a sufficiently large size (30 or more elements) follows a normal distribution, regardless of the population distribution.


The psychologist Mónica Ferrero affirms that depression is NOT a disease, but a DECISION. When we have some misfortune (the loss of a loved one, a broken relationship, the loss of a job), it is normal and necessary to be sad for a while; before any loss it is necessary to "elaborate the duel", "to cross that pain" in order to overcome it and grow from it.

Sadness is often associated with depression. There is depression if the sadness lasts at least six months; besides the "resignation, the abandonment". Depression is diagnosed when the person "throws in the towel", surrenders and "renounces life". And that is a decision. No one is guilty of something painful happening in their life and feeling sad, but they can decide what to do, so they have two options, face the problem or surrender. With this decision, growth is chosen from adversity, or the collapse and fall in depression.


Every action, however small it may seem, that remembers life before the nefarious incident, becomes the best antidepressant. The brain starts forming endorphins and substances similar to antidepressants. Perhaps in two weeks, the brain no longer believes that it is depressed, regains the desire to do things and the desire to "live".


In other activities or situations, in the normal curve, you jump from the left end to the right. It is a quantum leap, which requires changing points of view in a radical way. Do not worry about the rest, it's you who change and find the most comfortable space

References

SUPERAR LA DEPRESIÓN SIN FÁRMACOS